Use Case: KPI Tracking (Posting Issues from a dataframe)
Source:vignettes/tracking-KPIs.Rmd
tracking-KPIs.RmdThe utility of the post functions generally come not
when filing one-off issues but when automating a bulk upload of issues.
One use case for this is when using GitHub as a management platform for
business metrics tracking.
Tracking KPIs
As a toy example, suppose an analyst is already using R to report quarterly sales data and look for anomalous performance. After some wrangling, suppose their data looks something like this.
head(sales_data)
#>      region   month sales_amt sales_expected
#> 1 Northeast October      3144           5000
#> 2 Southeast October      5394           5000
#> 3   Midwest October      4204           4000
#> 4 Southwest October      7442           4000
#> 5 Northwest October      2470           2000
Assume they have some criterion to determine how much of a difference between actual metrics and expectations warrants further investigation. For simplicity in this example, we will look at observations exceeding 25% error. In this case, that yield two regions.
deviations <- dplyr::filter(sales_data, abs(sales_amt - sales_expected) >= 0.25 * sales_expected )
deviations
#>      region   month sales_amt sales_expected
#> 1 Northeast October      3144           5000
#> 2 Southwest October      7442           4000
Using purrr::pmap_chr(), it is easily to automatically
post these issues to a GitHub repository. The result returned is the
number of the GitHub issues posted.
# create custom function to convert dataframe to human-readable issue elements

post_kpis <- function(ref, region, month, sales_amt, sales_expected){

  post_issue(ref,
                    title = paste(region,
                                  ifelse(sales_amt < sales_expected, "below", "above"),
                                  "sales expectations in",
                                  month),
                    body = paste(
                      "**Region**: ", region, "\n",
                      "**Month**: ", month, "\n",
                      "**Actual**: ", sales_amt, "\n",
                      "**Expected**: ", sales_expected, "\n"
                    ),
                    labels = c(
                      paste0("region:",region),
                      paste0("month:",month),
                      paste0("dir:", ifelse(sales_amt < sales_expected, "below", "above"))
                    )
  )

}

# post as issues on GitHub
experigit <- create_repo_ref('emilyriederer', 'experigit')
pmap_chr(deviations, post_kpis, ref = experigit)
#> [1] 158 159
Results then appear as normal GitHub issues with whatever title, body, labels, or assignees you chose to specify. From here, various parties can discuss next steps in the comments, include in milestones, and ultimate seek to resolve the issue.
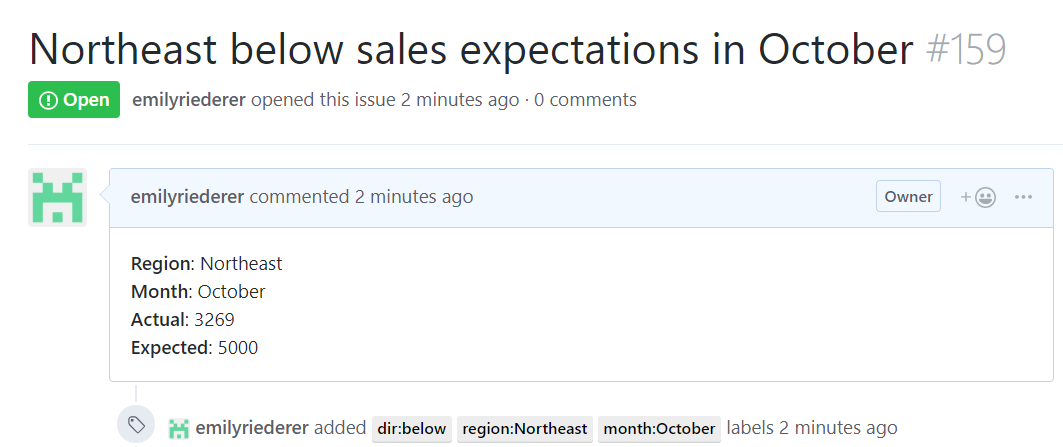
Issue created from out-of-bounds metric
A more complicated example
The same approach holds up to more complex dataframes comparing more
metrics. Suppose all of your expectations are contained in a “shadow
matrix”, similar to the treatment of missing data described in the naniar
paper.
head(performance_data)
#>      region   month sales_actual returns_actual visitors_actual sales_expected
#> 1 Northeast October         3023            310              64           5000
#> 2 Southeast October         5264            505             101           5000
#> 3   Midwest October         4446            407              80           4000
#> 4 Southwest October         7276            706             142           4000
#> 5 Northwest October         2228            201              45           2000
#>   returns_expected visitors_expected
#> 1              300                60
#> 2              200               100
#> 3              400               160
#> 4              700               140
#> 5              200                40
With a bit of data wrangling with tidyr, we can make one
unique record per region, month, and metric.
performance_pivoted <-
  performance_data %>%
  tidyr::gather(metric, value, -region, -month) %>%
  tidyr::separate(metric, into = c('metric', 'type'), sep = "_") %>%
  tidyr::spread(type, value)

print(performance_pivoted)
#>       region   month   metric actual expected
#> 1    Midwest October  returns    407      400
#> 2    Midwest October    sales   4446     4000
#> 3    Midwest October visitors     80      160
#> 4  Northeast October  returns    310      300
#> 5  Northeast October    sales   3023     5000
#> 6  Northeast October visitors     64       60
#> 7  Northwest October  returns    201      200
#> 8  Northwest October    sales   2228     2000
#> 9  Northwest October visitors     45       40
#> 10 Southeast October  returns    505      200
#> 11 Southeast October    sales   5264     5000
#> 12 Southeast October visitors    101      100
#> 13 Southwest October  returns    706      700
#> 14 Southwest October    sales   7276     4000
#> 15 Southwest October visitors    142      140
After that, the process of identifying deviations and posting these to a repository is the same as above.