Use Case: Project Planning & Stakeholder Updates (Posting & reporting custom plans)
Source:vignettes/analysis-projects.Rmd
analysis-projects.RmdCommunicating analytical results is a core part of the data science process. A related but less appreciated task is communicating analysis plans and progress to various stakeholders throughout a project. This need is a recurring theme across disciplines. Lucy D’Agostino McGowan discusses how to lead effective check-ins with dissertation committees in her blog post One Year to Dissertate and Jen Thompson describes the central role that “data people” play in project management of cross-functional clinical research teams in her blog post (and related talk) The Data Person as Project Manager. The same need is also readily apparent in corporate settings where it can be crucial for analysts to articulate how they are spending their time and set expectations on when they can deliver results.
Despite the benefits of project management, communcating to stakeholders has significant overhead and can risk stealing time from core job responsibilities. For those “data people” that use R and GitHub, conducting project planning and reporting with the same toolkit can reduce complexity and the inefficiencies of switching between contexts and tools.
Both Lucy and Jen’s recommendations emphasize the importance of
facilitating meetings and documentating agreed upon plans and
deliverables. projmgr’s concept of “plans” provides an
interface for these project management tasks. Plans can be created in
YAML and delivered to various customers in their preferred format. For
the analyst, they can be automatically posted to a GitHub repo as a set
of issues and milestones for easy tracking and linking to commits and
pull requests. For sharing with senior stakeholders who are not on
GitHub, both plans and progress updates can be formatted into aesthetic
RMarkdown reports, similar to the examples Lucy’s blog shows for meeting
agendas and minutes.
Planning Your Project in YAML
Writing out your plan of attack in YAML lets you focus on key details and allows everything to remain easily editable while you refine your approach. Lightweight, plain-text YAML can even be tracked by git to record any changes over time.
Recall the example plan discussed in the vignette on custom plans:
- title: Data cleaning and validation
  description: >
    We will conduct data quality checks,
    resolve issues with data quality, and
    document this process
  due_on: 2018-12-31T12:59:59Z
  issue:
    - title: Define data quality standards
      body: List out decision rules to check data quality
      assignees: [emilyriederer]
      labels: [a, b, c]
    - title: Assess data quality
      body: Use assertthat to test decision rules on dataset
      labels: [low]
    - title: Resolve data quality issues
      body: Conduct needed research to resolve any issues

- title: Exploratory data analysis
  description: >
    Create basic statistics and views to better
    understand dataset and relationships
  issue:
    - title: Summary statistics
      body: Calculate summary statistics
    - title: Visualizations
      body: Create univariate and bivariate plots
Convert YAML to GitHub Milestones and Issues
As described in the custom plans vignette, this could be added to a
GitHub repo as issues and milestones with the post_plan()
function, like this:
plan <- read_plan("plan.yml")
my_repo <- create_repo_ref("emilyriederer", "my_repo_name")
post_plan(my_repo, plan)
This can help you keep yourself organized or align priorities with technical collaborators on GitHub.
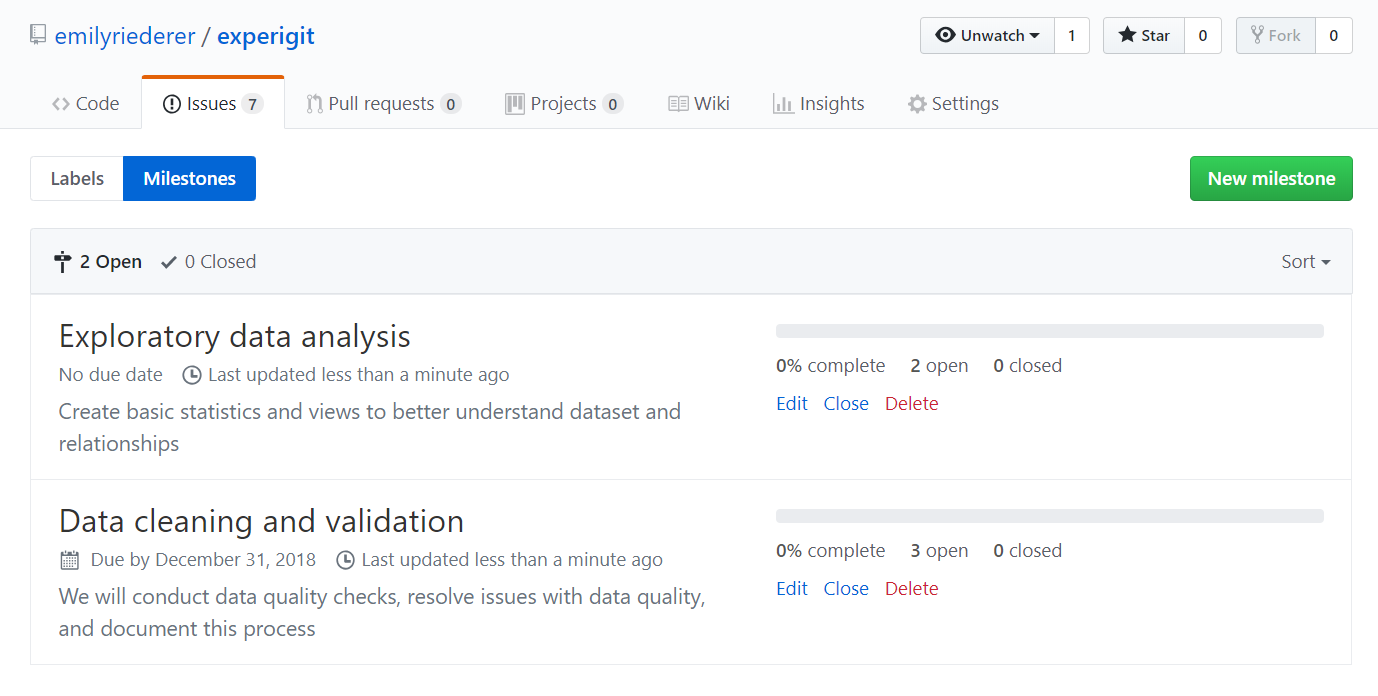
Milestones posted on GitHub
Reporting Project Plans and Progress
To communicate with those not on GitHub, report_
functions convert plans to HTML which can be inserted into
RMarkdown-based meeting agendas, minutes, presentations, or other team
communications.
plan_path <- system.file("extdata", "plan.yml", package = "projmgr", mustWork = TRUE)
my_plan <- read_plan(plan_path)
report_plan(my_plan)
- ☐ Define data quality standards
- ☐ Assess data quality
- ☐ Resolve data quality issues
- ☐ Summary statistics
- ☐ Visualizations
Similarly, as tasks are completed and their related issues are closed
on GitHub, that information can be pulled back down from GitHub. The
complementary report_progress() function reformats GitHub
issues for a consistent report of an in-progress plan.
issues <-
  get_issues(analysis_repo, state = 'all', since = '2018-12-01') %>%
  parse_issues() %>%
  filter(issues, milestone_created_at >='2018-12-25' & milestone_created_at <= '2018-12-31') %>%
  arrange(milestone_number)
report_progress(issues)
(Note that an hypothetical remaining “open” issue is not checked.)
For some audiences, posted plan data could also be shown visually
with functions such as viz_gantt(), which could plot either
time-to-completion data or a Gantt plot based on anticipated milestone
due dates. Similarly, changes to plans – neccessitated by analytical
deep dives or other work priorities – can be communicated with
viz_waterfall(), which plots changes in total issue count
(potentially grouped by milestone) over a fixed time period. See the
Visualizations vigentte for more details.